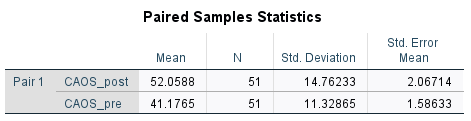
“Do students’ average scores on CAOS tend to increase after taking my (Professor Showalters’) stats course? And, if so, by how much?
This is a Right - Tailed question.
SPSS
Step 2. “Do students’ average scores on CAOS tend to increase after taking my (Professor Showalters’) stats course? And, if so, by how much?” This is a Right - Tailed question.
Step 3.
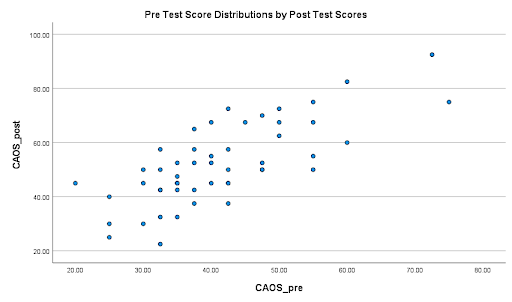
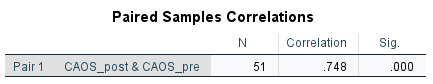
The higher a student scored on the CAOS pre test was shown to result in a higher score for the students CAOS post test score according to the data.
Step 4.
Step 5.
My null hypothesis is that Students average scores on CAOS tend to stay the same after taking the stats course. In symbols, H0: μd = 0 My alternative hypothesis is Students average scores on CAOS tend to increase after taking the stats course. In symbols, Ha: μd > 0
α = .05
Assumption 1: The Samples are Dependent (Matched Pairs). Yes, the scores of the students' test scores is a ratio-level variable.
Assumption 2: The Matched Pairs came from a Simple Random Sample. No, the data came from students in previous statistics classes that will be treated as a reasonably representative group of the students but is not a simple random sample of all the students.
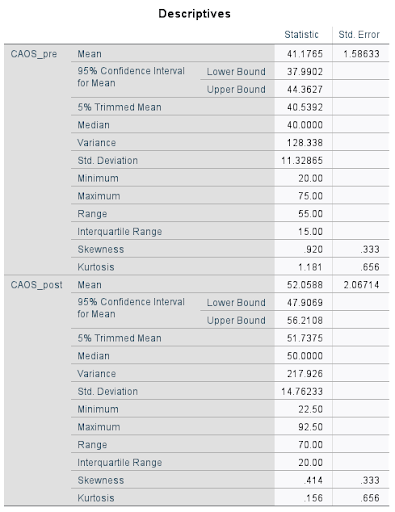
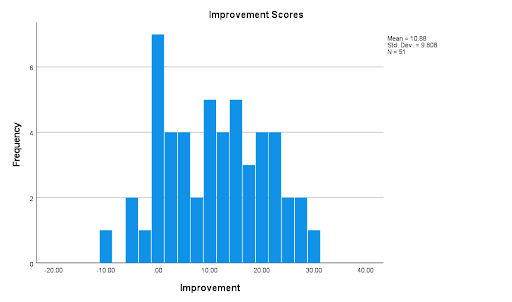
Assumption 3: The Number of Pairs of Sample data is large (n > 30) or the differences are approximately normally distributed. Yes, not only does the population follow a fairly Normal distribution, but the sample size is 51.
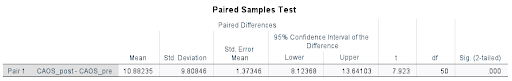
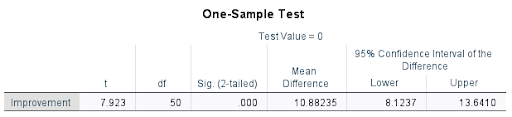
Degrees of freedom = 50, which sends me to the row with 100 on Table D. Critical t-value is 2.009.
Because my t-statistic of 7.923 is further out in the right tail than my critical value of 2.009, I would reject my null hypothesis. In other words, this is a statistically significant result. As confirmation of this, I have p < .001, which is well below my .05 level of significance. Because I am rejecting the null hypothesis, it is possible that I am making a Type I error.
Our data suggests that Students average scores on the CAOS post test tend to increase by an average of 8.1 to 13.6 points from their CAOS pre test.
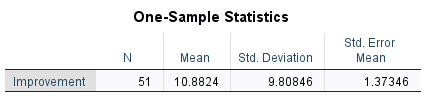
Step 6. The Student with the I.D. number of 11’s score decreased by 5 points.
Step 7.
T-Test
Step 8. My biggest limitations were (a) the fact that my sample was not random and (b) the questionable accuracy of the CAOS Pre and Post test scores in measuring if students Comprehensive Assessment of Outcomes in a first statistics course test scores average tended to increase after taking the stats class due to the students taking the stats class.
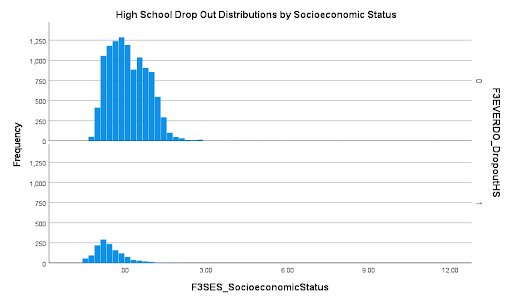
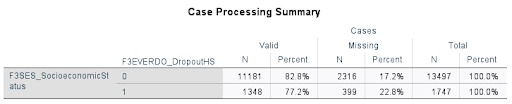
Step 9. I will be analyzing the data on the episode of students being a high school dropout (nominal) and their socioeconomic status (scale). I’m quite familiar with the effects that a stable socioeconomic status can have on a students academic performance, progression and opportunity in accordance to education but am not quite sure about the extent/degree that it affects other people/students. Since I have had a good deal of obstacles that have arised in my path in accordance to finishing my education due to socioeconomic factors, I am curious to see the statistics of how other students are affected/ the outcomes it ultimately had on their education. My theory is that students who did not have an episode of being a high school drop out will outperform those that did and have a higher socioeconomic status on average as opposed to the students that did dropout of high school and to which will have a lower socioeconomic status on average.
Step 10. Both distributions look roughly Normal. The no occurrence or episode of drop out distribution looks a bit higher in the center, whereas there seem to be more occurrences of drop outs on the lower end of the Histogram (and the two histograms have the same scale on the y-axis).
Step 11.

Step 12. My research question is, “Do those who dropped out of high school, on average, have a different socioeconomic status than those who finished high school?”
Step 13.
My null hypothesis is that those that dropped out of high school have the same average socioeconomic status as those who finished high school. In symbols, H0: μ1 - μ2 = 0. My alternative hypothesis is that those that dropped out of high school do not have the same socioeconomic status as those who finished high school. In symbols, Ha: μ1 - μ2 ≠ 0.
α = .05
Assumption 1: The samples are independent of one another. Some students would have attended the same school or be in the same area, but for the most part, they are independent.
Assumption 2: Both samples are simple random samples. No, but they did come from proportional random samples. (If this were an official study, we’d want to account for the weighting variable and some byproducts of some students being chosen from the same school -- you don’t need to write this part.)
Assumption 3: The populations from which the samples are drawn are both either Normally distributed or contain at least 30 data points. Yes, both appear Normal, and in any case, the sample sizes are each over 1,000.
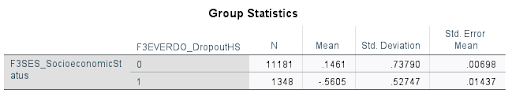
Assumption 4: The population standard deviations are not known and we do not assume they are equal. Yes, we’d have to have data on all 3 million students that year to know these values. The variances might be equal, but the descriptives suggest that the standard deviation might be higher for a no drop out occurrence or episode, so we will be conservative and not assume they are equal
.
T-Test


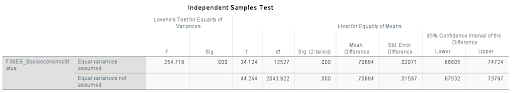
Degrees of freedom = 2,043, which sends me to the row with 1,000 on Table D. Critical t-value is 1.962.
Because my t-statistic of 44.244 is further out in the right tail than my critical value of -1.962, I would reject my null hypothesis. In other words, this is a statistically significant result. As confirmation of this, I have p < .001, which is well below my .05 level of significance. Because I am rejecting the null hypothesis, it is possible that I am making a Type I error.
Our data suggest that those who don’t dropout of high school have a higher socioeconomic status on average by about .68 to .74 points on the prestige score scale..
Power in Numbers
Project Gallery


