Analysis of Daily Decibel Usage
Why this is important?: I use headphones a majority of the time in order to focus on what I am doing and repeated, long-term exposure to loud sounds can lead to permanent damage so I am curious to how my headphone audio level patterns line up with recommendations.
SPSS
Step 1. I will be analyzing the number of decibels of my headphone audio levels that I experience over a sample of 30 days. I will be collecting the data using my iphone, which uses my headphone audio levels to keep track of and calculate the number of decibels that the audio levels of my headphones were at that day. This is important to me because I use headphones a majority of the time in order to focus on what I am doing and repeated, long-term exposure to loud sounds can lead to permanent damage so I am curious to how my headphone audio level patterns line up with recommendations.
Step 2. Are my headphone audio levels more than the recommended amount of decibels that is ok to be exposed too day to day. This is a right-tailed question.
Step 4.
Step 5.
Step 6.
My null hypothesis is that the decibel levels of my headphones are more than the recommended level of exposure per day. In symbols, H0: μ = 80 db. My alternative hypothesis is that I am getting less than this amount. In symbols, Ha: μ < 80 db.
α = .05
Assumption 1: The data is quantitative. Yes, decibel levels of headphone audio per day is a ratio-level variable.
Assumption 2: The data came from a random sample. No, the data came from the days when I just happened to use my headphones. It’s possible that they are not fully representative of my “typical” exposure of decibel levels per day.
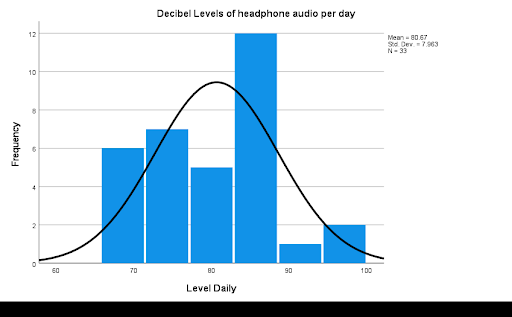
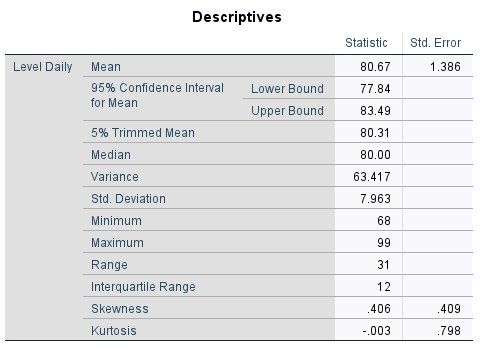
Assumption 3: The population is Normally distributed or the sample size is at least 30. Yes, not only does the population follow a fairly Normal distribution, but the sample size is 33.
Assumption 4: The population standard deviation is unknown. Yes, I would have to know what the decibel levels of my headphones are at every single day in order to calculate this.
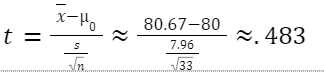
Calculation of the test statistic, t:

Degrees of freedom = n - 1 = 32. Critical t-value is 1.694.
Because my t-statistic is further out in the right tail than my critical value, I would reject my null hypothesis. Because I am rejecting the null hypothesis, it is possible that I am making a Type I error.
My data suggest that I am exposing myself to higher/more decibel levels per day than the recommended average of decibel level of 60-80 dbs.
Power in Numbers
Project Gallery