Predictive and Statistical Modelling (Actuarial Sciences/ Poisson & Pareto Distributions)
** Domain Knowledge Needed **
-Predictive modeling for insurance reserves.
-How to calculate aggregate claims and expected costs.
-How to find Value at Risk (VaR) for reserves.
** Tasks Completed **
-Create a presentation about reserves and data analysis.
-Review assumptions, fit distributions, and calculate losses.
-Determine VaR and consider modeling enhancements.
Digital Intelligence
Claims Modelling Distribution Parameters of the claims distribution
Assumptions
Claims Modelling
Separate models are used for WIS claims and non-WIS claims. For both types of claims a frequency-severity model applies. It is assumed that WIS claims and non-WIS claims occur independently of each other. All claims, i.e. attritional and large claims, are considered in the model and no further separate modelling is required.
Distribution
A Poisson distribution has been selected to model the claims frequency, i.e. the number of claims during one year. This is based on the assumption that claims are independent of each other. Due to the nature of the cover this assumption is considered to be reasonable.
A Pareto distribution has been selected for the claims severity. The Pareto distribution has a long tail, which ensures that the model produces extremely large losses which have not been observed in the past. In addition, extreme value theory provides a mathematical basis for the assumption of a Pareto distribution for extreme losses.
Parameters of the claims distribution
WIS claims and non-WIS claims are considered separately to estimate the parameters of the respective distribution. The annual claims frequency per site for WIS claims and per landfill for non-WIS claims is derived from the incurred non-zero claims.
The Pareto distribution, which is used to model the severity, has two parameters. Since it is difficult to estimate the shape parameter of the Pareto distribution based on a very limited data set, the standard value for property business of 1.5 is used. This produces a relatively long tailed distribution.
The location parameters of the Pareto distributions are estimated such that the mean of the distribution matches the average observed claims.
Available loss data
The following loss data from the last 5 years is available to determine the parameters of the loss distribution. The data has been split between the claims types WIS and non-WIS.
Before the aggregate loss model can be fit to the data, the loss amounts need to be on-levelled to current year amounts using an indexation of 3% p.a. to allow for monetary inflation since the time of the loss.
The historical reported loss data in mCHF per site and per claim and per year is as follows.
We note that the exposure of insured 4 WIS and 2 Non-WIS sites per year has been stable throughout the historical data recorded from 2016 to 2020. Use this exposure to calibrate the constant frequency parameter.
Available loss data (table)

Quantitative Reasoning and Methodology Overview for Technical Documentation/How I arrived at my Solution
The amount to be booked for the equalisation reserves shall be determined as of 31 December 2020 for claims that potentially occur in the year 2021.
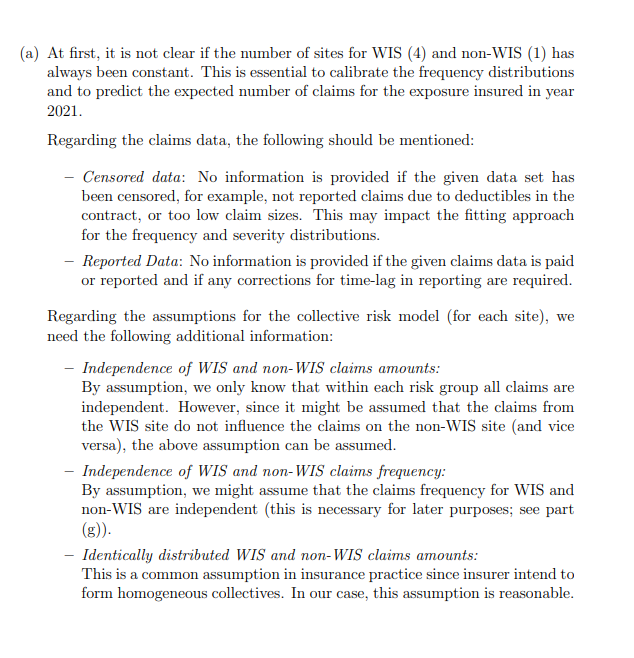
a) Do you have all the information available (e.g. regarding claims data, assumptions for distributions or the collective risk model) that is required to fit the data to the collective risk model of each risk type (i.e. WIS, non-WIS) and, thus, to derive the aggregate loss distributions? If not, which information is potentially missing? If any, apply expert judgment and explain your decisions you made.
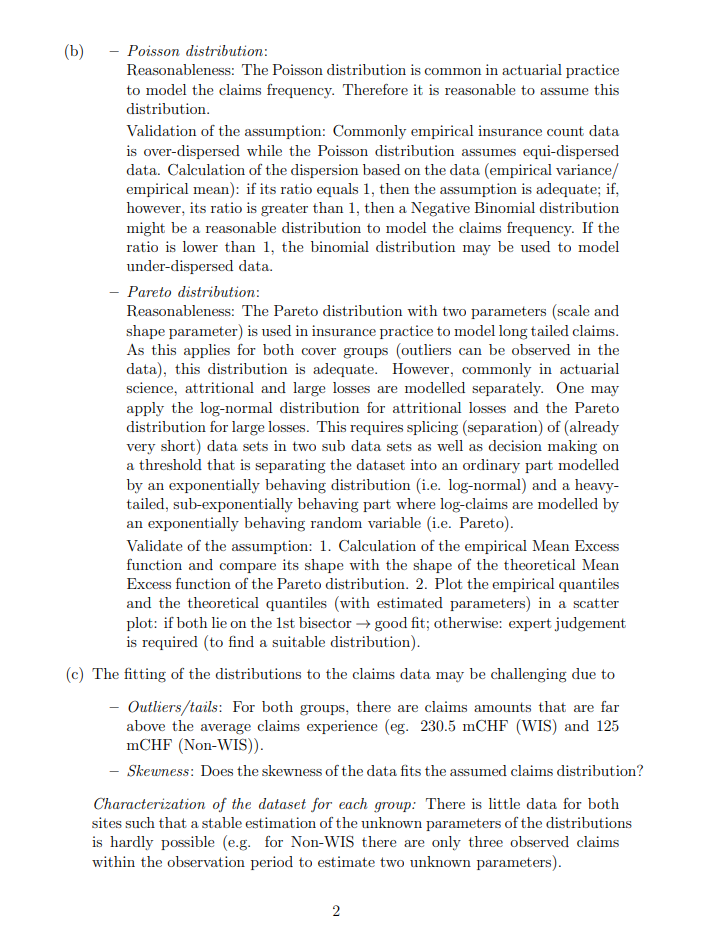
b) Are the assumptions made for each of the claims’ frequency and severity distributions reasonable? How could you validate it?
c) What challenges are you most likely facing given the data? How would you characterise the dataset of each type of site?
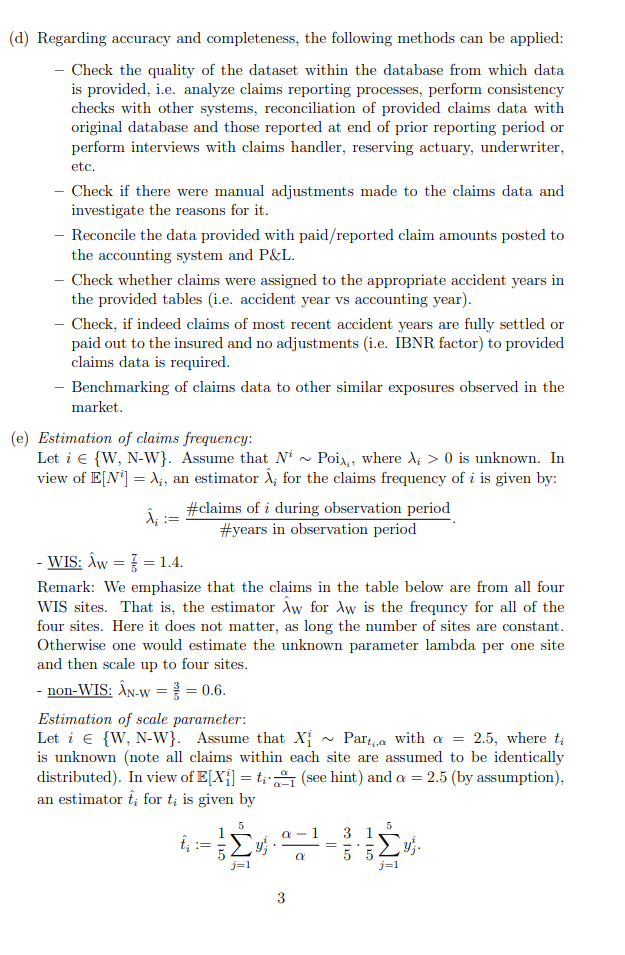
d) How could you validate the provided data set regarding its accuracy and completeness?
e) Which parameters do you obtain when you are fitting the claims frequency and severity distributions for each site to the provided data set?
f) What is the expected value of the claims for the current year 2021 at the individual (i.e. for each site) as well as at the aggregate level? Do you need a simulation tool or can the expected values be derived analytically?
g) Approximate the Value at Risk at level 80% of the (total) aggregate loss distribution for both risk types using the standard normal distribution (or “CLT”) to obtain an estimate of the equalisation reserves to be set up by the insurer.
h) Quantify the impact on the expected aggregate loss for year 2021 if the claims frequency for both sites immediately doubles?
i) How could the modelling approach be further improved?
j) Could you apply Machine Learning methods to this example? Explain.
Bonus question: Without performing any simulations, is it possible to estimate the confidence interval at the 80% level for the expected aggregate loss (sound statistical approximations can be applied)?
(Below is my solution of How I would model this problems paramaters to solve in a sound Quantitative and Statistical manner. There are many ways to go about formulating Statistical Procedures for this problem but I chose this due to my belief that the data set would have been too risky to employ Machine Learning Methods due to it's small size and risk of losing statistical accuracy if done via another method.)