
Instagram Reach Forecasting using Python
Many individuals limit their use of social media, in which I myself oftentimes completely avoided it in the past during times of important exams. Regardless, content creators must still be able to determine the optimal time to take advantage of making content and when not too. Thankfully, Instagram Reach Forecasting can help content creators do this effectively with a little added help from Python!
Instagram Reach Forecasting
Instagram reach forecasting can be summed up as the process of utilizing predictive analysis ustilizing the number of people that a story, post or other content will reach based on historical data and other varying factors.
Predicting the reach can be a valuable tool for planning and optimizing an effective social media strategy, especially in the case of content creators. Obtaining literacy of content performance metrics allows for more informed decisions in accordance to strategizing the optimal time to publish content, the types of content that are actually effective to viewers, and how to more effectively interact with ones following. Undoubtedly, it's not outlandish to imagine how this can ultimately result in achieving greater success of ones platform better performance metrics from increased engagement.
The following data set consists of data during a particular time period in Instagram Reach -
Instagram Reach Forecasting utilizing Python
The first step is to import the necessary Python libraries and the dataset we will be using for this task.
import pandas as pd
import plotly.graph_objs as go
import plotly.express as px
import plotly.io as pio
pio.templates.default = "plotly_white"

data = pd.read_csv("Instagram-Reach.csv", encoding = 'latin-1')
print(data.head())
Output():
                  Date  Instagram reach
0  2022-04-01T00:00:00             7620
1  2022-04-02T00:00:00            12859
2  2022-04-03T00:00:00            16008
3  2022-04-04T00:00:00            24349
4  2022-04-05T00:00:00            20532
Next, the Date Column must be converted into a datetime datatype format to effieciently move forward in the process.
data['Date'] = pd.to_datetime(data['Date'])
print(data.head())
Output():
        Date  Instagram reach
0 2022-04-01             7620
1 2022-04-02            12859
2 2022-04-03            16008
3 2022-04-04            24349
4 2022-04-05            20532
Analyzing Reach
Now we can analyze the trend in the data to get a better understanding of the relationship between Instagram Reach and time utilizing a line chart.
fig = go.Figure()
fig.add_trace(go.Scatter(x=data['Date'],
                         y=data['Instagram reach'],
                         mode='lines', name='Instagram reach'))
fig.update_layout(title='Instagram Reach Trend', xaxis_title='Date',
                  yaxis_title='Instagram Reach')
fig.show()
Next we can analyze Instagram Reach for each day utilizing a bar chart:
fig = go.Figure()
fig.add_trace(go.Bar(x=data['Date'],
                     y=data['Instagram reach'],
                     name='Instagram reach'))
fig.update_layout(title='Instagram Reach by Day',
                  xaxis_title='Date',
                  yaxis_title='Instagram Reach')
fig.show()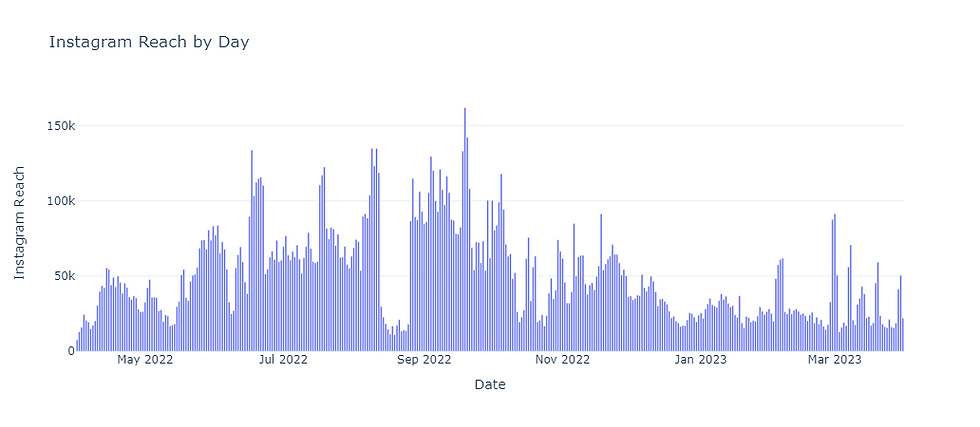
Analyzing the distribution of Instagram Reach using a box plot:
fig = go.Figure()
fig.add_trace(go.Box(y=data['Instagram reach'],
                     name='Instagram reach'))
fig.update_layout(title='Instagram Reach Box Plot',
                  yaxis_title='Instagram Reach')
fig.show()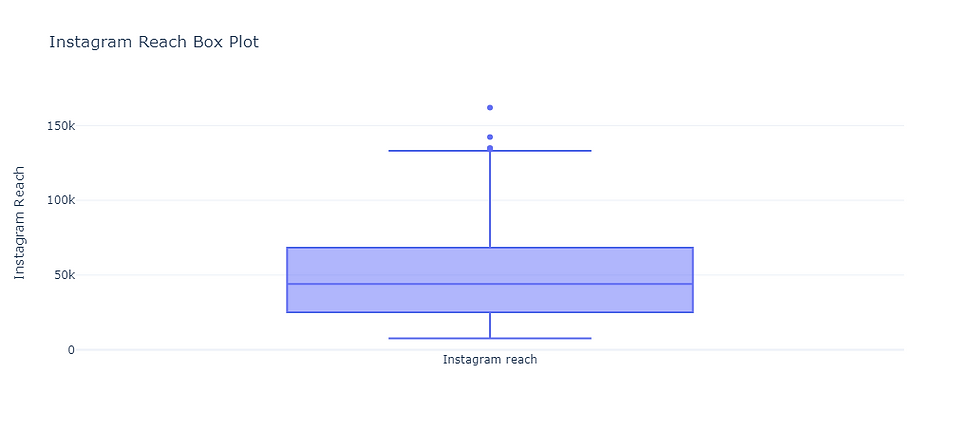
We can now create a day column in order to analyze reach in accordance to days of the week. To do this we will utilize an extraction method to extract the days of the week from the Date column with dt.day_name()
data['Day'] = data['Date']. dt.day_name()
print(data.head())
Output():
 Date  Instagram reach       Day
0 2022-04-01             7620    Friday
1 2022-04-02            12859  Saturday
2 2022-04-03            16008    Sunday
3 2022-04-04            24349    Monday
4 2022-04-05            20532   Tuesday
We now have the ability to analyze the reach based on the days of the week. We will do this by grouping the DataFrame by the Day column and calculate the mean, median, and standard deviation of the Instagram Reach column recorded for each individual day:
import numpy as np

day_stats = data.groupby('Day')['Instagram reach'].agg(['mean', 'median', 'std']).reset_index()
print(day_stats)
Output():
   Day          mean   median           std
0     Friday  46666.849057  35574.0  29856.943036
1     Monday  52621.692308  46853.0  32296.071347
2   Saturday  47374.750000  40012.0  27667.043634
3     Sunday  53114.173077  47797.0  30906.162384
4   Thursday  48570.923077  39150.0  28623.220625
5    Tuesday  54030.557692  48786.0  32503.726482
6  Wednesday  51017.269231  42320.5  29047.869685
Next lets make a bar chart to better visualize the Reach that was recorded for each day of the week:
fig = go.Figure()
fig.add_trace(go.Bar(x=day_stats['Day'],
                     y=day_stats['mean'],
                     name='Mean'))
fig.add_trace(go.Bar(x=day_stats['Day'],
                     y=day_stats['median'],
                     name='Median'))
fig.add_trace(go.Bar(x=day_stats['Day'],
                     y=day_stats['std'],
                     name='Standard Deviation'))
fig.update_layout(title='Instagram Reach by Day of the Week',
                  xaxis_title='Day',
                  yaxis_title='Instagram Reach')
fig.show()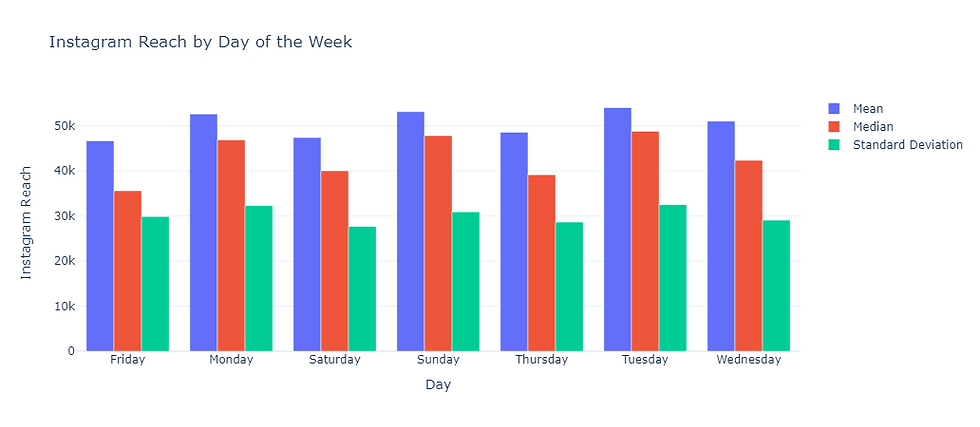
Instagram Reach Forecasting through Time Series Forecasting
No pun intended here but to forecast Reach, we can literally use Time Series Forecasting to get a better understanding of the Seasonal Patterns and Trends within the Instagram Reach Data (The irony would make an NLP text-sentiment analysis algorithm chuckle a little bit!!)
from plotly.tools import mpl_to_plotly
import matplotlib.pyplot as plt
from statsmodels.tsa.seasonal import seasonal_decompose

data = data[["Date", "Instagram reach"]]

result = seasonal_decompose(data['Instagram reach'],
                            model='multiplicative',
                            period=100)

fig = plt.figure()
fig = result.plot()

fig = mpl_to_plotly(fig)
fig.show()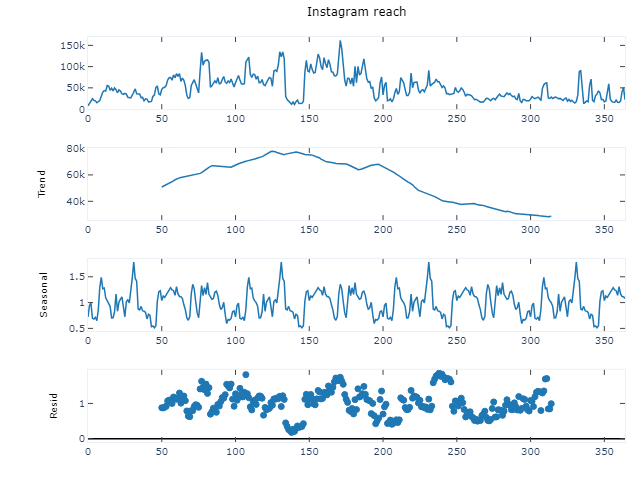
Hmmm...... so it appears that the Reach is affected by the variable of Seasonality, so the best course of action would be to utilize a SARIMA model to forecast the Instagram Account's Reach. We will do this by first identifying the the p, d, and q values to in order to forecast the data. We can utilize an autocorrelation plot for uncovering the value of d and a partial autocorrelation plot for the value of q (the value of d will be 1).
Our goal of employing the autocorrelation plot will be to find the value of p:
pd.plotting.autocorrelation_plot(data["Instagram reach'])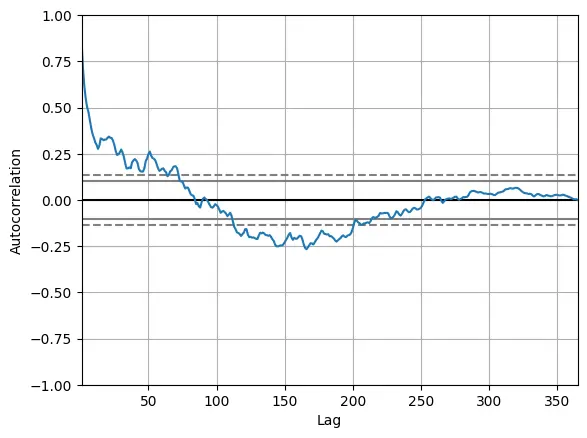
Now let's visualize the partial autocorrelation plot to find the value of q:
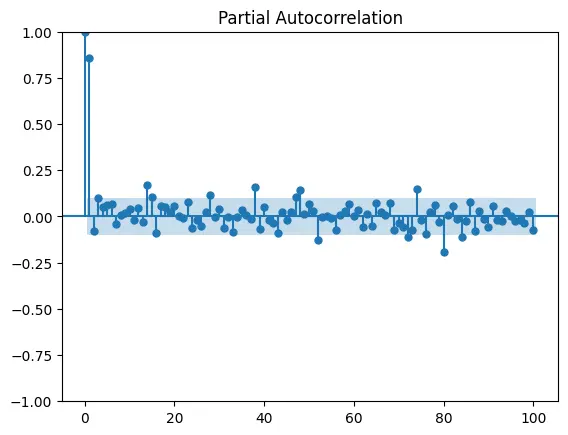
from statsmodels.graphics.tsaplots import plot_pacf
plot_pacf(data["Instagram reach"], lags = 100)
Next step is to train a model using SARIMA!!!:
p, d, q = 8, 1, 2

import statsmodels.api as sm
import warnings
model=sm.tsa.statespace.SARIMAX(data['Instagram reach'],
                                order=(p, d, q),
                                seasonal_order=(p, d, q, 12))
model=model.fit()
print(model.summary())
Lets have a look at the Forecasted Reach and make predictions based on the SARIMA model we trained.
predictions = model.predict(len(data), len(data)+100)

trace_train = go.Scatter(x=data.index,
                         y=data["Instagram reach"],
                         mode="lines",
                         name="Training Data")
trace_pred = go.Scatter(x=predictions.index,
                        y=predictions,
                        mode="lines",
                        name="Predictions")

layout = go.Layout(title="Instagram Reach Time Series and Predictions",
                   xaxis_title="Date",
                   yaxis_title="Instagram Reach")

fig = go.Figure(data=[trace_train, trace_pred], layout=layout)
fig.show()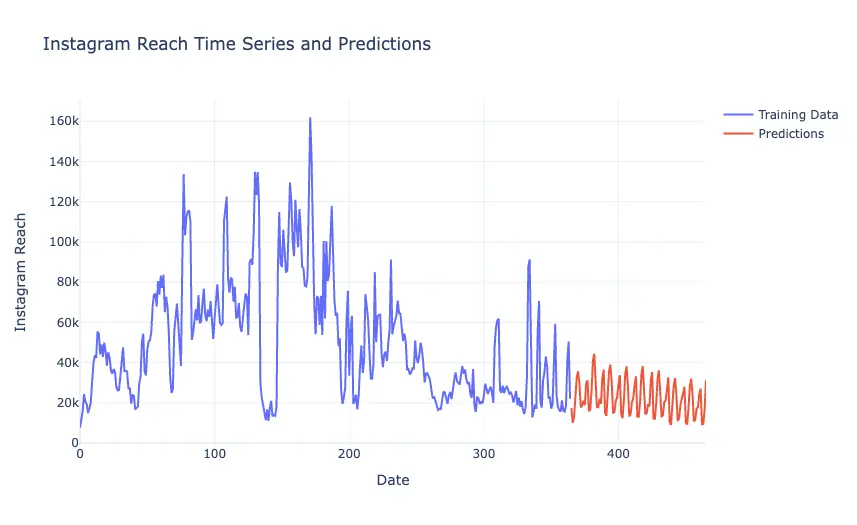
Summary
We have just succesfully conducted a Time Series Forecast on the Reach of an Instagram Account! This means that we just effectively predicted the number of people an Instagram story, post, or other content will have reached based on the historical data and various other factors, so technically.... we just used statistical methods to tell the future just like a superpower.
Power in Numbers
Project Gallery


